
Net Revenue Retention: The Loyalty Metric SaaS & B2B Brands Can't Ignore
Most SaaS and B2B growth conversations focus on top-of-funnel activity: new logos, pipeline coverage, and customer acquisition cost. These metrics matter, but they tell an incomplete story. The commercial reality for subscription-based businesses is that the majority of revenue, often 70% to 80% of it, comes from existing customers. The metric that captures how well a company is managing and growing that base is Net Revenue Retention, and in 2025 it has become the single most scrutinised figure in B2B SaaS performance measurement.
What is Net Revenue Retention (NRR)?
Net Revenue Retention, also referred to as Net Dollar Retention (NDR), measures the percentage of recurring revenue retained from an existing cohort of customers over a defined period, after accounting for all revenue gains and losses within that base. Gains include upsells, cross-sells, and tier upgrades. Losses include downgrades, contract reductions, and complete churn.
NRR is a cohort-based metric. It measures what happened to a specific population of customers across a defined window, typically one month or one year, rather than the total revenue trajectory of the business. This makes it a precise instrument for understanding the revenue dynamics of existing relationships in isolation from new customer acquisition.
An NRR above 100% means the company is generating more revenue from its existing customer base at the end of the period than it was at the beginning, even after accounting for lost accounts. This is the property that makes high NRR so commercially powerful: it creates organic growth without requiring any new customer acquisition, which compresses the capital required to sustain revenue momentum.
How to Calculate NRR?
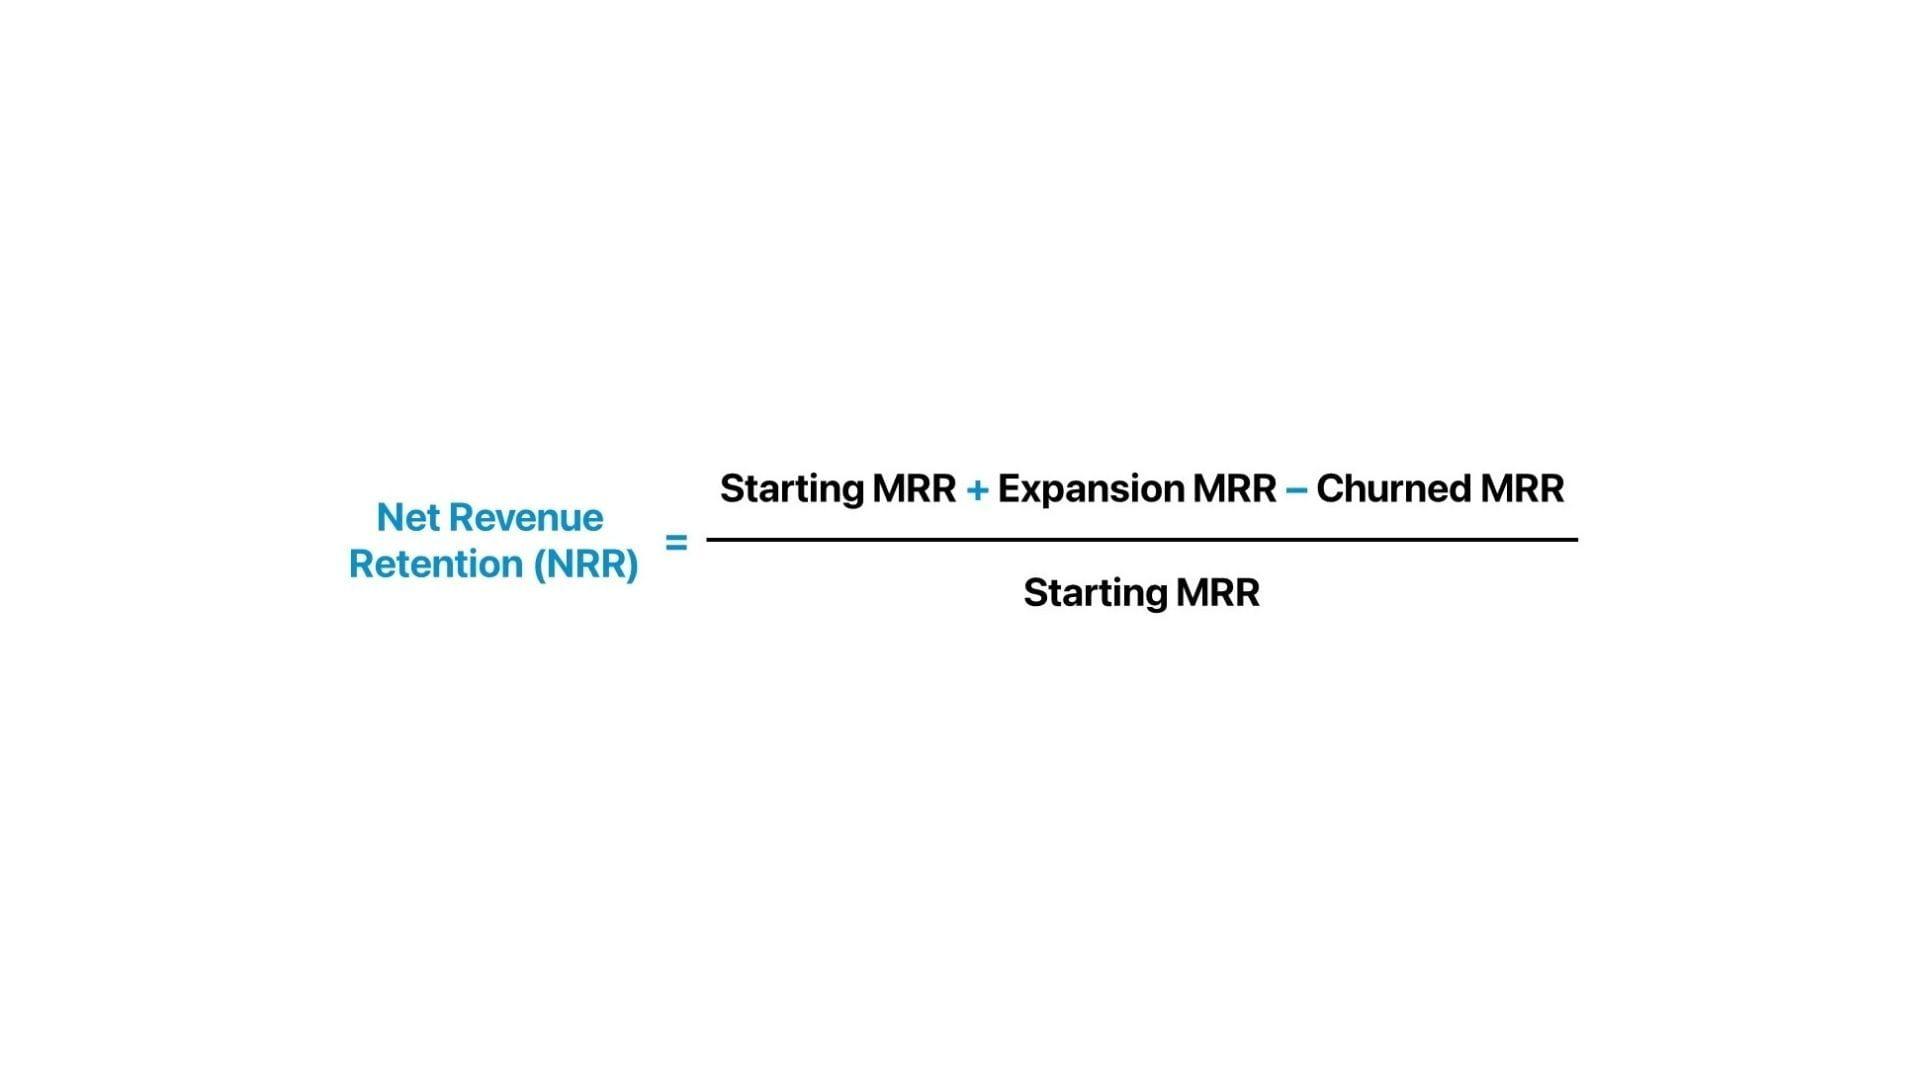
The formula for NRR is:
NRR = ((Starting MRR + Expansion MRR - Contraction MRR - Churned MRR) / Starting MRR) x 100
To illustrate: a company starts a month with £500,000 in Monthly Recurring Revenue from its existing customer base. During the month, upsells and tier upgrades add £60,000 in expansion MRR. Downgrades reduce revenue by £12,000, and one account cancels, removing £8,000. The calculation is:
(£500,000 + £60,000 - £12,000 - £8,000) / £500,000 x 100 = 108%
An NRR of 108% means the company grew its existing revenue base by 8% during the measurement period, without acquiring a single new customer. Measured annually, a consistent NRR of 108% compounds materially: a £10 million ARR business maintaining that rate adds approximately £800,000 in ARR from its existing base each year before any new sales activity.
NRR should be calculated on the same cohort of customers across the measurement window. Customers acquired during the period are not included in the starting MRR figure, which isolates the metric from acquisition activity and makes it a clean measure of existing customer revenue health.
NRR vs. Gross Revenue Retention
Gross Revenue Retention (GRR) and NRR measure related but distinct aspects of the customer base. Understanding the difference between them is essential for diagnosing where revenue risk actually sits.
GRR measures only revenue losses: churn and contraction. It cannot exceed 100% because it does not include expansion. Its formula excludes upsells and upgrades entirely:
GRR = ((Starting MRR - Contraction MRR - Churned MRR) / Starting MRR) x 100
NRR includes both losses and gains, which is why it can exceed 100%. The gap between GRR and NRR in any given period reveals the scale of the expansion motion: a company with 88% GRR and 108% NRR is recovering 20 percentage points of lost revenue through upsells and cross-sells. That looks healthy from the NRR line, but it conceals a significant churn problem that expansion revenue is temporarily masking.
This is the diagnostic value of tracking both metrics in parallel. An NRR that is strong but rests on a weak GRR foundation is a warning signal, not a clean bill of health. Best-in-class B2B SaaS businesses maintain both a high NRR and a GRR above 90%, meaning they are retaining most of their existing base while also growing it through expansion.
What is a Good NRR Benchmark?
NRR benchmarks vary by company size, market segment, and customer type. Based on 2025 data across multiple benchmarking studies, the picture is as follows.
The median NRR for B2B SaaS companies is 106%, according to ChartMogul's analysis of over 2,100 software businesses. Top-performing companies exceed 120%, and best-in-class enterprise SaaS operations regularly report NRR above 130%. For bootstrapped SaaS companies in the £2.5 million to £16 million ARR range, SaaS Capital's 2025 benchmark places the median at 104% and the 90th percentile at 118%.
By segment, enterprise-focused companies typically achieve higher NRR, in the 115% to 125% range, because they operate with structured account management, formal expansion playbooks, and multi-year contracts that provide more opportunity to grow account value. SMB-focused SaaS typically operates in the 90% to 105% range, reflecting higher churn rates in the smaller customer cohort and fewer natural upsell pathways.
An NRR below 100% is a clear signal that the existing customer base is shrinking in revenue terms. For a company relying on growth from existing accounts to offset high acquisition costs, a sub-100% NRR is structurally incompatible with capital-efficient scaling. For investors evaluating SaaS businesses, NRR below 100% consistently raises questions about product-market fit and customer success operational effectiveness.
How Loyalty Programmes Drive NRR?
Loyalty mechanics address NRR from both directions: by reducing the revenue losses that suppress GRR, and by creating the conditions for expansion that push NRR above 100%.
On the retention side, structured loyalty programmes for B2B customers create accumulated value that raises the cost of switching. A client who has built a usage history, achieved a certification status within a platform's partner programme, or holds reward credits applicable to future contracted services faces a tangible financial disincentive to downgrade or cancel. This is the B2B equivalent of the accumulated balance mechanism in consumer loyalty: the switching cost is real and quantifiable.
On the expansion side, loyalty programmes that recognise and reward product adoption depth, multi-product usage, and referral activity create a structured pathway from a single-product relationship to a multi-product one. A customer who has unlocked a higher programme tier by adopting two product modules is a better upsell candidate for a third than one who has had no engagement with a formal recognition framework. The programme signals the customer's investment in the relationship and makes the expansion conversation natural rather than transactional.
Customer success teams equipped with loyalty programme data also have more precise early warning signals. A customer whose loyalty engagement score is declining, measured through session frequency, feature usage, and programme interaction, is exhibiting churn risk behaviours earlier than their support ticket volume or NPS response would indicate.
Strategies to Improve NRR Through Customer Success and Loyalty
The most commercially effective NRR improvement programmes combine structured account management with loyalty mechanics that operate continuously between human touchpoints.
Onboarding depth determines first-year retention. Research consistently shows that customers who reach defined activation milestones in the first 90 days have materially higher 12-month retention rates. Structuring an onboarding programme that guides customers to activation and rewards progression through onboarding stages with recognition or programme credits creates both accountability and positive reinforcement.
Usage-based health scoring triggers proactive intervention. Customer health scores built from product usage data, login frequency, feature adoption breadth, and programme engagement allow customer success managers to identify at-risk accounts before they generate a support ticket or a renewal negotiation. Loyalty programme engagement is a particularly sensitive leading indicator because it reflects discretionary investment in the relationship beyond the minimum required to use the product.
Expansion playbooks anchored to loyalty milestones. Structuring expansion conversations around loyalty tier thresholds, where moving to the next tier unlocks specific benefits and requires adoption of an additional product, converts what would otherwise be a sales-initiated conversation into a customer-initiated progression. The customer sees the benefit of expanding before the conversation is opened, which changes the dynamic of the renewal and expansion discussion.
Community and certification as loyalty infrastructure. In B2B SaaS, customer communities and certification programmes function as loyalty mechanics without being labelled as such. A customer whose team has completed platform certifications, contributed to a user community, or participated in a customer advisory board has made a social and professional investment in the vendor relationship that pure product usage does not replicate. These investments are harder to abandon than a software subscription.
NRR as a North Star Metric for B2B SaaS
The case for NRR as the primary performance indicator in B2B SaaS is structural, not merely conventional. SaaS companies with high NRR grow faster with less capital: research shows that high-NRR companies grow approximately 2.5 times faster than their low-NRR counterparts when controlling for acquisition spend. This is because strong NRR creates a compounding base that amplifies the effect of new customer acquisition rather than requiring acquisition merely to replace lost revenue.
Investor scrutiny has consolidated around NRR as the most reliable predictor of sustainable SaaS business quality. In the capital markets conditions of 2024 and 2025, where growth-at-all-costs has given way to demands for capital efficiency, NRR has become a valuation driver in a way it was not in an era of cheap capital. A publicly traded SaaS business with NRR above 120% commands a meaningfully higher revenue multiple than one with NRR at or below 100%.
For go-to-market teams, NRR as a north star metric changes internal resource allocation. It shifts the balance of investment from acquisition toward retention and expansion, creates shared accountability between customer success, product, and commercial teams for existing revenue, and forces the organisation to treat every existing customer as an active commercial relationship rather than a passive recurring revenue line. The loyalty architecture that supports this shift is not an optional programme feature. It is a core operational capability.