What is a Heatmap?
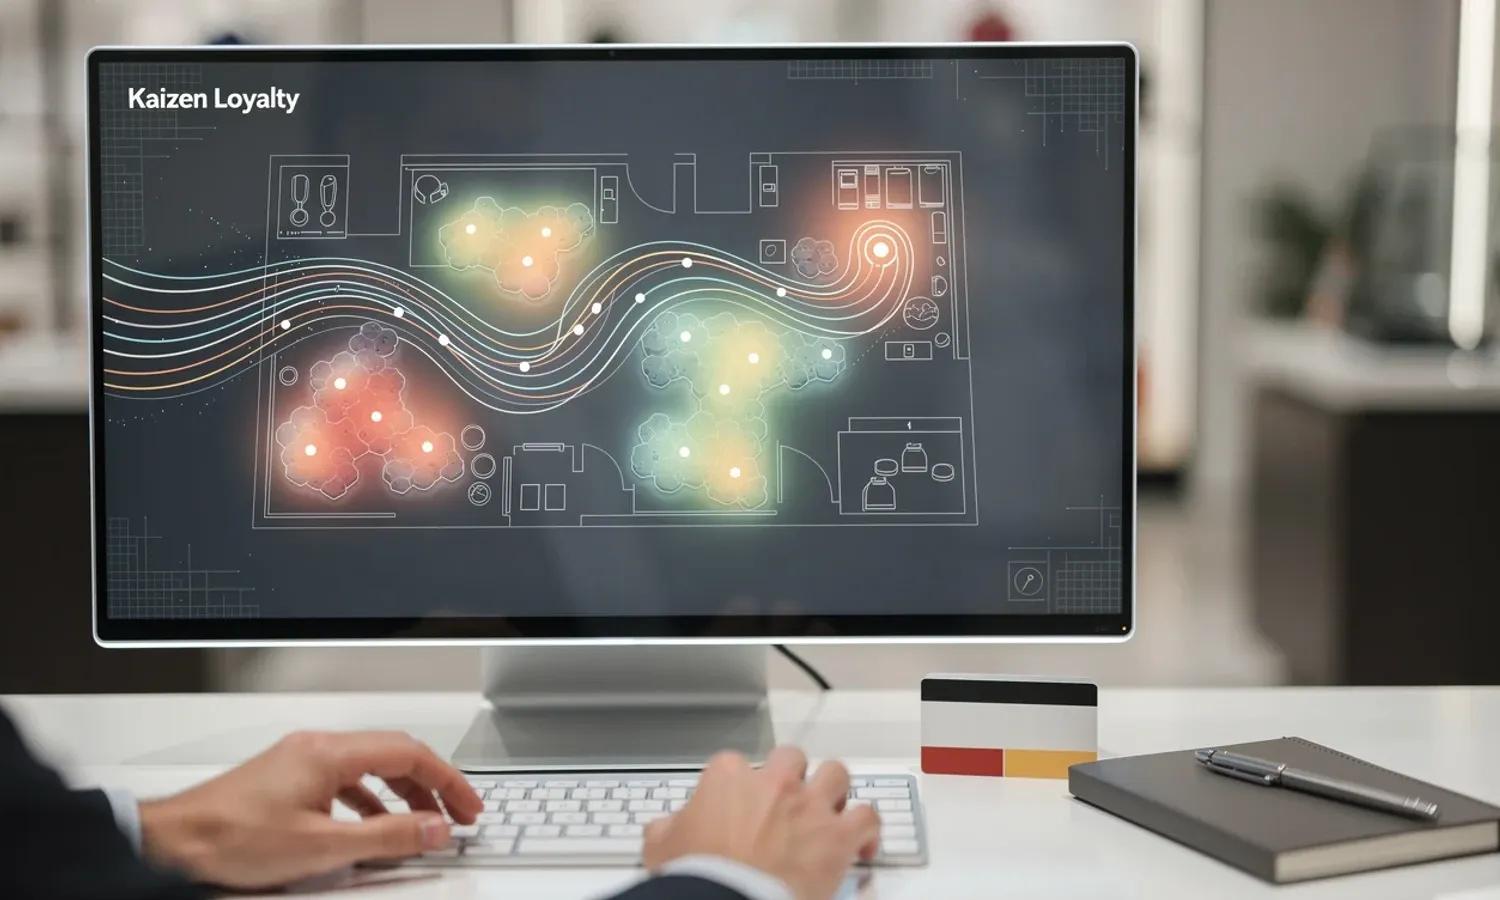
A heatmap is a data visualization technique that represents user interaction on a webpage using a color-coded overlay. Areas of high activity are displayed in warm colors such as red and orange, while areas of low or no activity are shown in cooler tones such as blue or green. The resulting image gives product, design, and marketing teams a fast, visual read of how visitors are engaging with a page without requiring them to interpret raw interaction logs.
In web analytics and conversion rate optimization, heatmaps aggregate behavioral data from multiple sessions to produce a composite view of how a page performs across its user base. They are most commonly used to evaluate landing pages, product pages, checkout flows, and any page where user behavior directly affects conversion outcomes.
Types of Heatmaps
Different heatmap types capture different dimensions of user behavior. The most widely used are:
- Click heatmaps: record where users click or tap on a page, including clicks on non-interactive elements such as static images or plain text. This reveals mismatches between what users expect to be clickable and what actually is.
- Scroll heatmaps: show how far down a page users scroll before leaving. They identify the fold line for a given audience and help determine whether important content is positioned within the visible viewport for most visitors.
- Move heatmaps: track cursor movement on desktop sessions. Because eye gaze and cursor position correlate loosely, move heatmaps are used to approximate reading patterns and areas of visual attention, though they are less precise than eye-tracking studies.
- Rage click heatmaps: a subset of click data that isolates rapid, repeated clicks on a single element. These indicate user frustration, often caused by broken links, unresponsive UI components, or elements that appear interactive but are not.
How Do Heatmaps Work?
Heatmap tools collect interaction data through a JavaScript snippet embedded in the page. The script captures click coordinates, scroll depth, and cursor position for each session and sends this data to the tool's servers. Across thousands of sessions, the tool aggregates these data points and renders them as a color gradient overlaid on a screenshot of the page.
Most tools segment heatmap data by device type, since mobile and desktop users interact with the same page differently. Some platforms allow further segmentation by traffic source, user segment, or date range, which is useful for comparing behavior across audience groups or measuring the impact of a design change.
Benefits of Using Heatmaps
Heatmaps surface behavioral patterns that quantitative analytics alone cannot reveal. Standard web analytics platforms report that users are leaving a page, but they do not explain why. Heatmaps provide the spatial context needed to form a hypothesis about the cause.
For CRO practitioners, heatmaps reduce the time spent speculating about user behavior and increase the precision of A/B test hypotheses. Rather than testing multiple design variants simultaneously, teams can use heatmap data to identify the specific element driving poor performance and test a targeted fix. This reduces testing cycles and the statistical sample required to reach significance.
For loyalty and e-commerce platforms, heatmaps are particularly useful for diagnosing friction in reward redemption flows, identifying which program benefits attract the most attention on a landing page, and determining whether calls to action are positioned within the scroll depth that most users reach.
How to Use Heatmaps to Improve Your Website?
The most productive use of heatmaps is to pair them with a specific conversion question. Before reviewing heatmap data, identify the metric you are trying to improve, whether that is click-through rate on a primary CTA, form completion rate, or scroll depth on a long-form page.
Cross-reference scroll heatmaps with click heatmaps to identify alignment issues. If the primary call to action sits below the point where 70% of users stop scrolling, repositioning it higher in the page hierarchy is a high-confidence intervention. If click heatmaps show significant activity on non-linked elements, adding navigation or a contextual link to those areas can recover lost intent.
Use rage click data as a bug detection layer. Concentrated rage clicks on a specific element are a reliable indicator of a technical or UX defect that may not surface in error monitoring tools.
Heatmap Tools and Best Practices
The most widely adopted heatmap platforms include Microsoft Clarity (free), Hotjar, Contentsquare, and Lucky Orange. Each offers click, scroll, and move heatmaps, with differences in session volume limits, segmentation capabilities, and integration depth with analytics and A/B testing platforms.
When implementing heatmaps, collect a minimum of 1,000 sessions per variant before drawing conclusions. Thinner samples produce unstable color distributions that can misrepresent actual user behavior. Segment data by device type as a baseline practice, since pooling mobile and desktop interactions on a responsive page produces a composite that accurately represents neither.
Treat heatmap findings as hypotheses, not conclusions. A heatmap shows what users did; it does not explain why. Combine heatmap analysis with session recordings and qualitative user research to build a complete picture before committing to a design change.