
What Is Churn? The Ecommerce Definition, Formula & Loyalty Strategies to Keep It Low
Every ecommerce business leaks customers. The question is not whether it happens but how fast, and whether the rate of loss is visible enough to act on. Churn is the metric that answers both questions. It quantifies what might otherwise feel like a vague sense that repeat purchase rates are softer than they should be, and it gives retention teams a concrete number to improve against.
Tracked consistently, churn is also one of the clearest signals of how well a brand is building genuine relationships with buyers, rather than simply acquiring them. This guide covers what churn means specifically in an ecommerce context, how to calculate it correctly, what drives it, and how loyalty infrastructure changes the economics of keeping customers.
What Does Churn Mean in Ecommerce?
Churn is the rate at which customers stop buying from a business over a defined period. In subscription-based businesses, the moment of churn is explicit: a customer cancels and the relationship formally ends. In non-subscription ecommerce, churn is inferential. There is no cancellation event. A customer simply stops returning, and the brand must decide at what point a lapsed buyer should be classified as lost rather than merely dormant.
The practical definition of churn for a non-subscription ecommerce store depends on the typical purchase cycle. A grocery delivery brand might define a churned customer as someone who has not ordered in 60 days. A premium skincare brand with a 90-day replenishment cycle might set the threshold at 180 days. The threshold should reflect actual shopper behaviour, not an arbitrary calendar window. Setting it too tight overstates churn; setting it too loose masks it until it is too late to intervene.
What makes churn particularly damaging in ecommerce is its compounding effect. A monthly churn rate of 5% sounds manageable. Applied annually, it means losing more than half your customer base in a single year. Most ecommerce brands do not visualise churn in annualised terms, which is why the problem tends to feel less urgent than it actually is.
How Churn Is Calculated
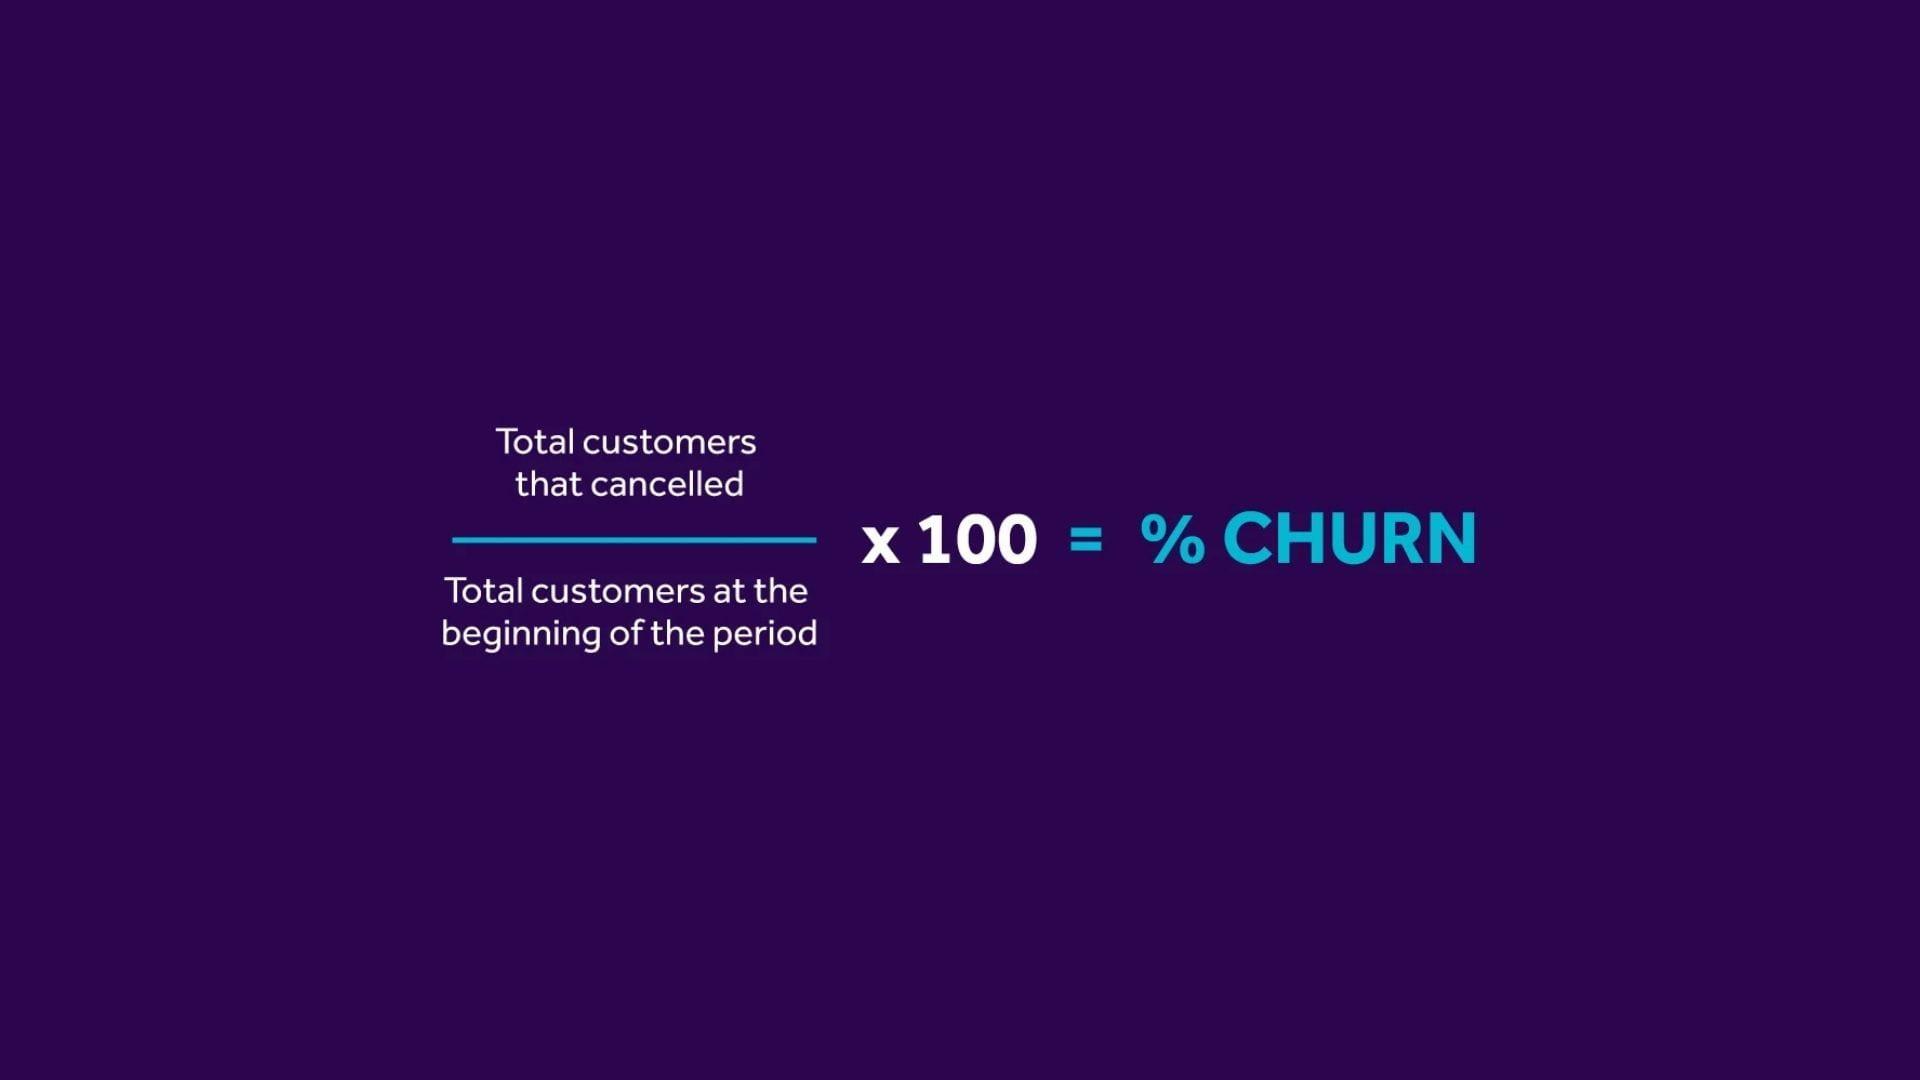
The standard churn rate formula divides the number of customers lost during a period by the total number of customers at the start of that period, expressed as a percentage:
Churn Rate = (Customers Lost / Customers at Start of Period) x 100
If a store begins a quarter with 5,000 active customers and 400 of them do not return within the expected purchase window, the quarterly churn rate is 8%. Annualised, that business is on a trajectory to replace its entire customer base within 12 to 15 months, which puts enormous pressure on acquisition spend to simply maintain revenue rather than grow it.
Revenue churn is a more precise complement to customer churn for businesses where spending is unevenly distributed across the customer base. It measures the proportion of revenue lost rather than the proportion of customers. If a small number of high-value customers churn in a given period while a larger number of low-value customers remain, customer churn will understate the financial impact. Revenue churn corrects for that distortion.
For non-subscription stores without clear cancellation events, cohort analysis is the most reliable measurement method. It tracks what percentage of customers acquired in a given month or quarter are still purchasing 3, 6, and 12 months later. Cohort analysis reveals not just your current churn rate but whether it is improving or deteriorating over time, which a single-period snapshot cannot show.
Types of Churn: Voluntary vs. Involuntary
Voluntary churn is the more familiar type: a customer actively decides to stop buying. They found a cheaper competitor, had a poor experience with delivery or customer service, lost interest in the product category, or simply forgot the brand existed. Voluntary churn requires work to address because it is rooted in either a product or experience failure, or in insufficient brand salience.
Involuntary churn happens without any deliberate decision on the customer's part. Payment failures, expired credit cards, and checkout errors prevent transactions from completing, and if the follow-up process is inadequate, those shoppers drift away without anyone on the brand's side registering that a relationship was at risk. Research from Paddle indicates that involuntary churn accounts for between 20% and 40% of total subscription churn, and the same dynamic applies in ecommerce when payment issues are not proactively resolved.
The significance of this distinction is strategic. Voluntary churn requires investment in experience, retention offers, and loyalty architecture. Involuntary churn can often be addressed through automated dunning sequences, payment retry logic, and card-update prompts, meaning it is typically the faster and cheaper problem to fix. Businesses that do not separate the two types conflate two very different problems and tend to apply the wrong solutions to both.
Churn in Ecommerce vs. SaaS: Key Differences
SaaS churn benchmarks appear regularly in ecommerce discussions, but they measure fundamentally different things. A healthy annual churn rate for a B2B SaaS product is typically 5% to 10%. For consumer-facing ecommerce, annual churn commonly exceeds 70% in traditional (non-subscription) stores. Applying SaaS standards to ecommerce leads to a false sense of comfort.
The structural reason for this divergence is switching friction. Cancelling enterprise software involves contract clauses, data migration, team retraining, and integration work. Leaving an ecommerce brand requires nothing. The competitor is one search query away, and there is no cost attached to switching beyond the minor effort of creating a new account. That frictionless exit is why ecommerce churn is structurally higher and why retention strategies need to create their own switching costs through loyalty points, tier status, and accumulated purchase history that the customer would forgo by leaving.
Subscription ecommerce sits between the two models. Recurly's 2024 benchmark data shows average monthly voluntary churn for consumer goods subscription businesses at around 3.3%, which annualises to roughly 34%. That is dramatically better than traditional ecommerce but still demands active management through strong first-90-day engagement, flexible subscription controls, and personalized reactivation when early disengagement signals appear.
What Causes Churn in Ecommerce?
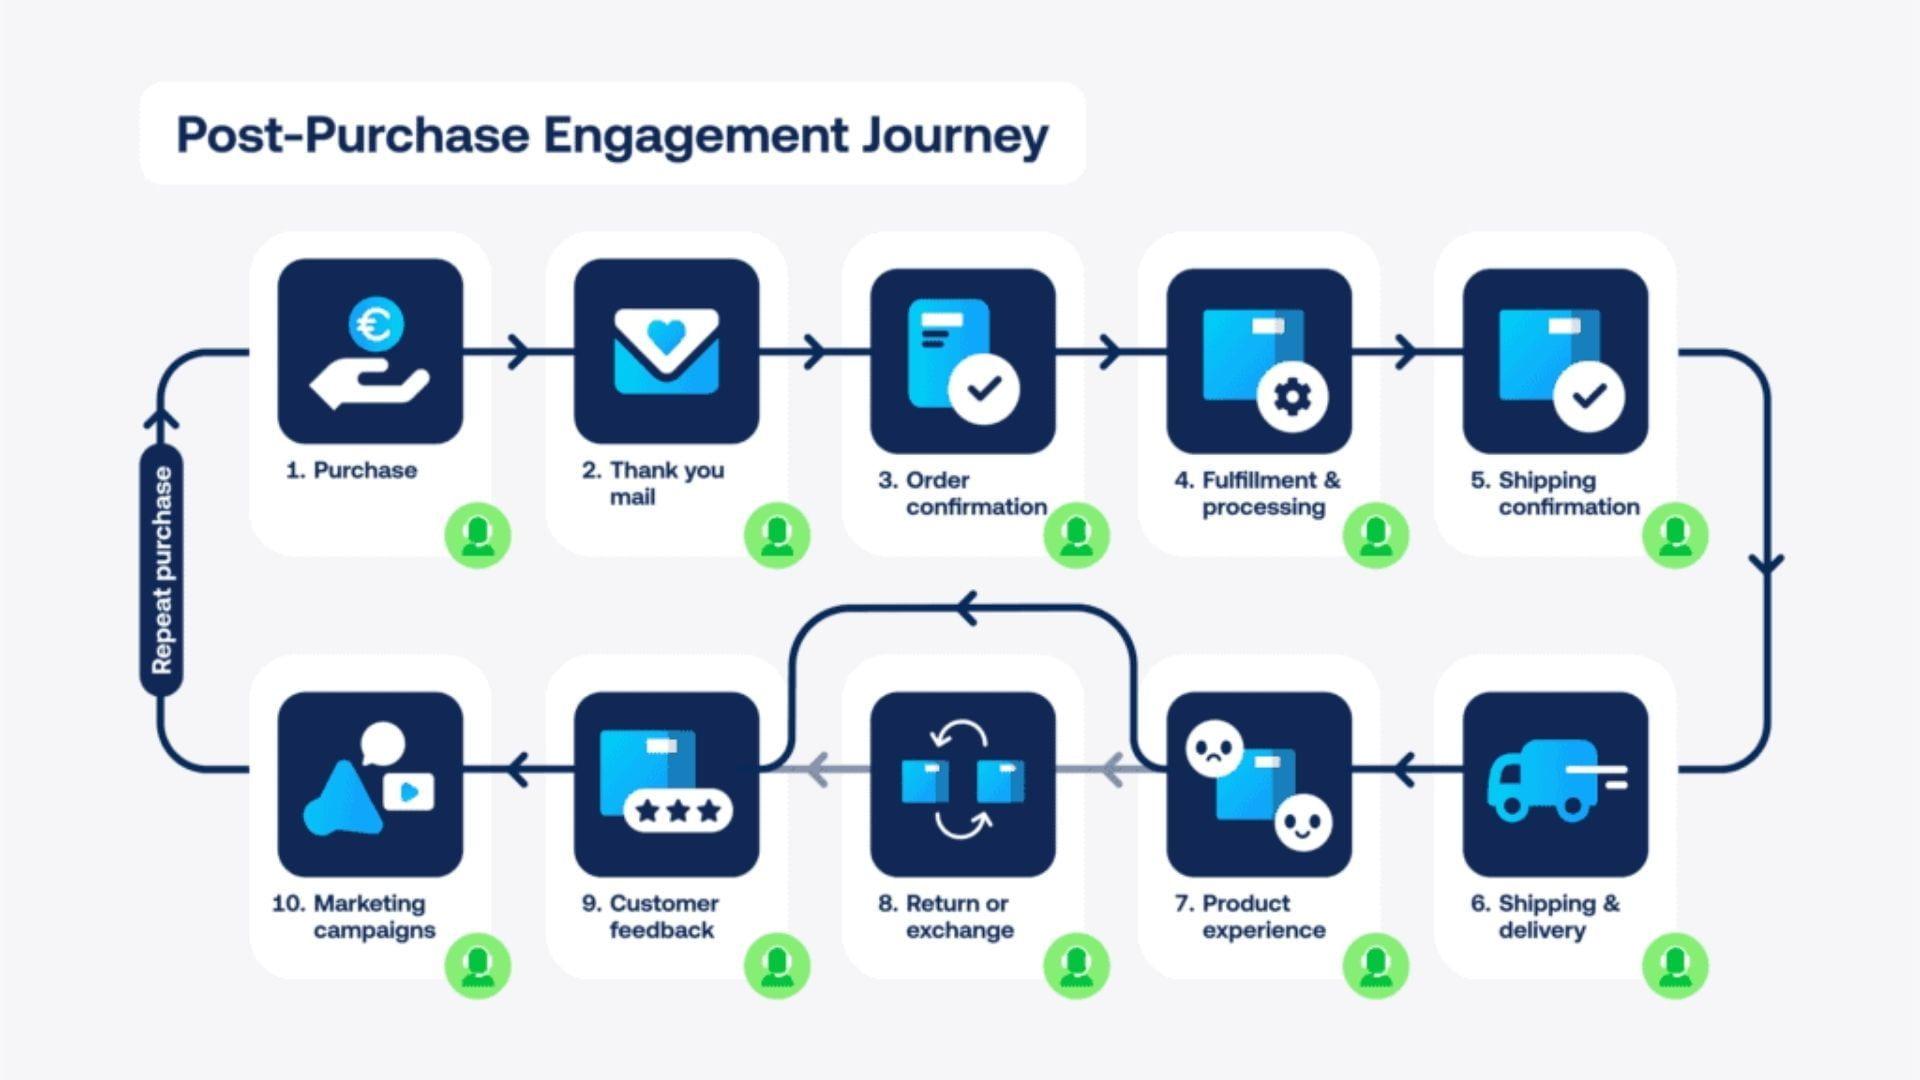
Poor post-purchase experience is consistently the leading cause. Research from Gainsight cited by rethinkCX found that 67% of customers reference poor service as a primary reason for leaving. Slow delivery, inadequate packaging, difficult returns processes, and support teams that fail to resolve issues on first contact all contribute. Customers who contact support and leave with an unresolved problem are significantly more likely to churn within the following 90 days than those whose issues were resolved at first contact.
Competitive pricing erodes loyalty where the brand's value proposition does not extend beyond the product itself. In heavily commoditised categories, a 10% price differential with minimal switching friction is sufficient to move a customer. Brands that compete solely on price are also the ones most susceptible to this form of churn, because they have trained their customers to prioritise cost over relationship.
Infrequent or irrelevant communication accelerates churn passively. A customer who receives no meaningful contact from a brand between purchases has little reason to develop affinity with it. Emails that are generic, promotional, or misaligned with the customer's actual purchase history make the problem worse by actively reducing open rates and inbox trust over time.
Finally, natural lifecycle churn deserves acknowledgement. Some customer loss reflects the organic end of a purchasing need rather than a brand failure. A customer who bought infant formula throughout a child's first year will eventually stop; that is not preventable. Distinguishing lifecycle churn from preventable churn helps brands focus retention resources where they will actually have an impact.
The Lifetime Value Impact of High Churn Rates
Churn and customer lifetime value are directly inverse. Every percentage point reduction in churn extends the average customer lifespan, which compounds across average order value and purchase frequency to produce a materially higher CLV. Research from Bain & Company, widely cited across the retention industry, establishes that a 5% improvement in customer retention can increase profits by 25% to 95%, a range that reflects variation across industry and margin structure.
The mechanism is straightforward. If a customer who currently stays active for an average of 18 months extends their relationship to 24 months because of a well-designed loyalty programme, the additional 6 months of purchasing behaviour costs almost nothing to generate. There is no incremental acquisition spend, no new onboarding cost, and the customer is likely to spend more per order and refer more frequently as their relationship with the brand matures.
The contrast with acquisition economics makes the case compelling. Customer acquisition costs have risen by over 200% in the past decade. A business spending heavily on paid acquisition to replace churned customers is essentially running in place: generating new revenue on one side while destroying it on the other. Reducing churn even modestly shifts that equation, allowing acquisition investment to contribute to genuine net growth rather than simply compensating for retention failure.
How Loyalty Programmes Reduce Churn
Loyalty programmes work against churn through several distinct mechanisms. The most direct is accumulated value: a customer who has earned points, achieved a tier, or has an unredeemed reward has a financial reason to return that a customer without a programme does not. This creates what behavioural economists call a sunk cost commitment, where the prospect of leaving means forfeiting something already earned.
Data from loyalty programme performance research consistently shows the impact at scale. Loyalty members demonstrate 47% lower churn rates than non-members. Members who actively redeem rewards spend 3.1 times more annually than those who earn but do not redeem, suggesting that the act of redemption itself reinforces the purchasing relationship rather than simply discounting it. Across well-structured programmes, the average ROI across industries sits at approximately 4.8 times programme cost.
Tiered structures amplify retention further. A customer who has reached a mid-tier status and is aware of what they stand to lose through inactivity faces a meaningful perceived cost of switching.
Personalisation within loyalty is what separates programmes that genuinely reduce churn from those that simply offer discounts. A reward that reflects the customer's actual purchase history communicates that the brand has been paying attention. That feeling of being recognised is one of the most reliable drivers of emotional loyalty, which in turn is the type of loyalty that survives a competitor's price promotion.
Building a Churn Dashboard for Your Ecommerce Business
A churn dashboard translates raw data into the leading and lagging indicators that retention teams can act on. The foundational metrics are customer churn rate (calculated monthly and by cohort), revenue churn rate, average customer lifespan, and repeat purchase rate. These four together give a complete view of how many customers are leaving, how much revenue that represents, how long customers typically stay, and whether repurchase behaviour is trending in the right direction.
Predictive signals belong alongside lagging metrics. Days since last purchase relative to that customer's personal average, email engagement trends, site visit frequency, and support ticket recency are all leading indicators that a customer is drifting toward churn before they actually leave. A dashboard that surfaces these signals at the individual customer level, rather than only in aggregate, allows for timely intervention rather than post-mortem analysis.
Segment-level visibility is the refinement that makes a churn dashboard operationally useful rather than merely informative. Churn rates broken down by acquisition channel, product category, loyalty programme membership, and customer tenure reveal which segments are most at risk and which retention interventions are working. A brand that knows its paid social customers churn at twice the rate of organic customers, for instance, has actionable information about both its acquisition strategy and where to concentrate loyalty programme enrolment efforts.
Reviewed weekly by retention teams and monthly at a leadership level, a churn dashboard converts an abstract concern about customer loss into a managed operational discipline. The brands that treat churn as a number to track rather than a behaviour to understand will always be on the wrong side of the retention equation.